The contractor quote for a rope-access transmission tower inspection is a specific number. Crew days, mobilization, travel, report deliverable. You can compare it against last year's quote and know whether the cost went up or down. But if you have been managing a transmission line inspection program for more than a few years, you know that the quote price is not the total cost. The gap between what the quote covers and what the inspection program actually costs is real, and in many programs it is larger than the direct inspection cost itself.
This post is about those other costs: the ones that are harder to line-item but are affecting your maintenance program and your asset condition data whether or not anyone is measuring them explicitly.
The Scheduling Lag and What It Actually Costs
Rope-access inspection contractors are booked. In most regions with substantial transmission infrastructure, the qualified contractor pool is tight relative to the total inspection demand, and summer and early autumn scheduling windows are fully committed by spring. If you need to add an unplanned inspection of a stretch of corridor that had a storm event or showed aerial anomalies, you are looking at a weeks-long queue before a crew can mobilize.
During that waiting period, the decision to intervene on a potentially deteriorating structure is deferred. That deferral has a cost that does not appear on any invoice. A steel member that might have been treated at a minor corrosion stage if caught in week 2 may be at a more advanced stage by week 8. The maintenance action required at the advanced stage is more expensive. The probability of a forced outage during the interval, small but non-zero, carries its own risk cost that a utility can calculate using its outage probability and cost models.
In practice, most utility maintenance programs have grown accustomed to these lags and treat them as background noise. The real cost shows up in aggregate: inspection backlogs that run 12 to 18 months, maintenance queues with unverified findings from the previous inspection cycle still waiting for follow-up, and growing uncertainty about the actual condition of assets that were "last inspected" on paper but actually had limited coverage in the filed report.
Coverage Gaps in the Inspection Record
Rope-access inspection reports are written by the crew that did the work. When a section is inaccessible due to weather, safety constraints, or geometry limitations, the standard documentation practice is to note "access limited" or "not inspected" for that section. In a well-run program, those gaps are tracked and followed up. In a program with resource constraints and a long queue, they are more likely to be carried forward into the next inspection cycle.
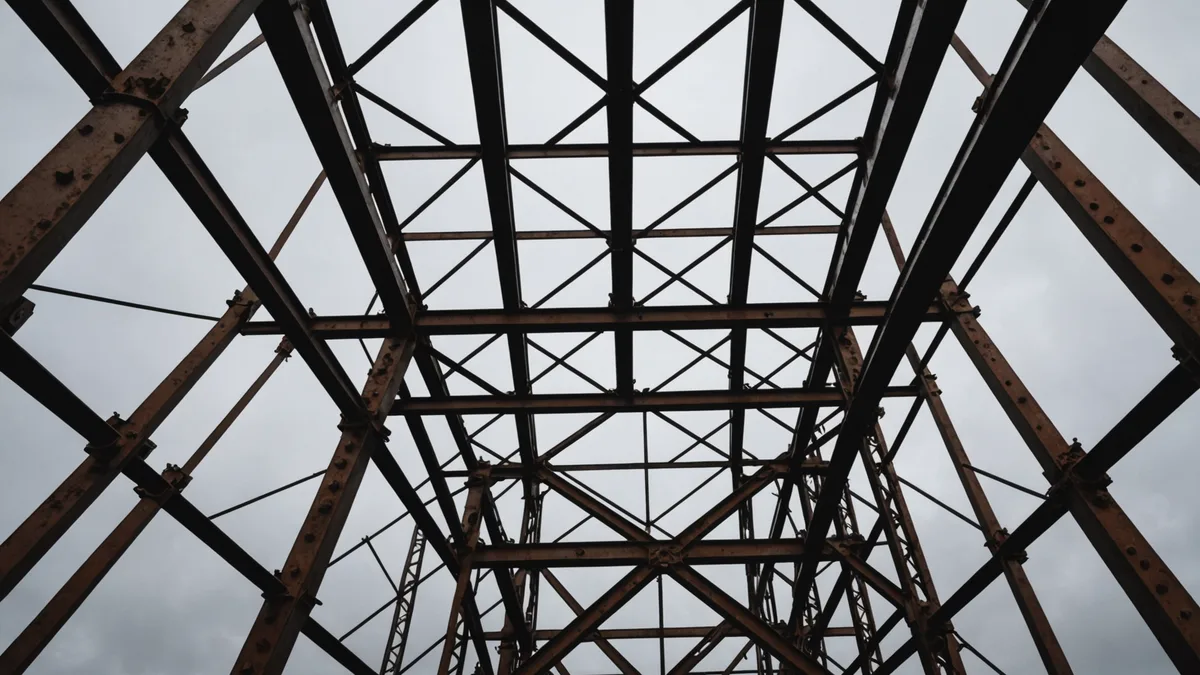
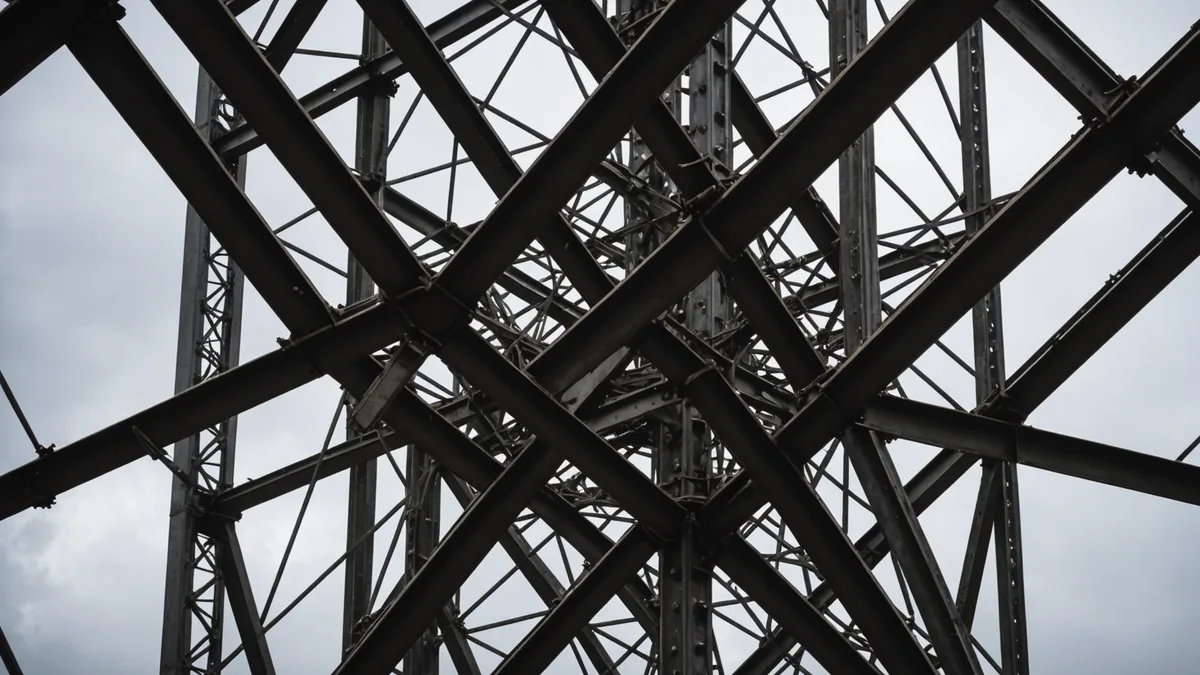
The geometry of transmission tower steel creates systematic coverage gaps in rope-access inspection. Interior angles of primary members, the undersides of diagonal bracing, the base plate and anchor bolt region at the tower foot, and the internal surfaces of tubular members where towers use hollow sections are all areas where a rope-access team's reach is limited by rigging geometry. These are also areas where moisture accumulates and corrosion initiates preferentially, which is not a coincidence.
Over multiple inspection cycles, systematic coverage gaps compound. A 15-year tower inspection record that has gaps in the base plate region and cross-member undersides of most entries does not tell you that those areas are in good condition. It tells you that they were not looked at. For asset management purposes, "not inspected" is not the same as "no defect found," and programs that treat it that way are accumulating untracked risk.
The Coordination Overhead That Nobody Tracks
Getting a rope-access inspection done requires substantial internal coordination on the utility side. Access permissions for right-of-way. Outage scheduling or arc flash clearance coordination if the crew is working near energized conductors at lower voltages. Notification to landowners and tenants along the corridor. Logistics coordination for crew access to remote tower locations. Contact with equipment repair teams to schedule parallel work during the access window to amortize mobilization cost.
All of this coordination takes internal staff time. In a large utility with a dedicated transmission maintenance team, this overhead is absorbed as part of normal operations and is not costed back to individual inspection projects. In smaller organizations, or when coordination responsibility is spread across multiple departments, the overhead is more visible and occasionally becomes a bottleneck that delays the inspection schedule independently of the contractor availability issue.
The coordination cost is relevant to the total inspection program budget even if it does not appear on the contractor invoice. When comparing inspection methods, ignoring internal coordination costs understates the real cost of approaches that require high coordination overhead.
Backlog Accumulation and Condition Uncertainty
In a program that relies entirely on rope-access inspection, the practical inspection frequency for a typical tower is once per year for structures in the active monitoring list, less frequently for the remainder of the fleet. For a tower that was last inspected 18 months ago in the context of a busy year with contractor availability problems, the current condition is genuinely unknown between inspection events.
That unknown condition period has a cost that is hard to quantify precisely but straightforward to reason about. The probability that a defect has initiated and progressed to a structurally significant state during the uninspected period is low for any individual tower. Across a fleet of several hundred towers, the probability that at least some have reached that state is considerably higher. The question is whether the inspection program is finding those cases before they cause problems, and backlog accumulation is a direct risk multiplier on that question.
Utilities with mature asset management programs increasingly track "inspection coverage debt" as a metric: the percentage of their fleet that is outside the intended inspection interval at any given point in the year. When that number rises above acceptable thresholds, it triggers remediation scheduling. But the metric only works if the underlying inspection intervals are calibrated to real condition risk, which requires understanding which parts of the fleet are most at-risk and therefore most benefit from higher inspection frequency.
What Changes When Inspection Frequency Can Increase
The hidden costs described above are not inevitable features of transmission tower inspection. They are consequences of inspection methods constrained by human climbing requirements and the labor economics of qualified rope-access crews.
When inspection frequency can increase without proportionally increasing crew mobilization cost, the economics shift. More frequent baseline data means shorter unknown-condition windows. Defect detection at earlier stages means lower per-defect remediation cost. Better coverage of structurally critical but geometrically difficult areas means the inspection record more accurately represents actual condition.
We are not arguing that the direct cost of any particular inspection method is irrelevant. It obviously matters, and total inspection program economics need to account for platform cost, deployment cost, and report processing cost alongside contractor day rates. The argument is that evaluating inspection methods only on direct cost misses the largest cost components for many programs, which are the coordination overhead, coverage gaps, and backlog accumulation that drive deferred maintenance and condition uncertainty. A program that reduces those factors, even at a comparable or higher direct inspection cost, may have a substantially better overall economics profile. That is the comparison that is worth doing carefully.